Btrax Design Company > Freshtrax > See It, Spark I...
See It, Spark It: How Visual Thinking Accelerates Innovation
“Just collecting everyone’s opinions doesn’t create anything new.”
Have you ever felt that way during a brainstorming session or while trying to develop a new business?
Every idea begins as vague and difficult to grasp. In team discussions, have you ever thought, “Wait, what are we talking about?”
That’s where visual thinking comes in. It’s a method for organizing unclear ideas into a form that everyone can see and understand. By making our thinking visual, we create a shared understanding within the team that enables us to solve problems more effectively. And from that shared understanding, new ideas emerge more easily. This is one of the key factors in driving innovation.
In this blog post, I’ll share how visualization can support new business creation and innovation. Drawing on my experience facilitating design thinking workshops in both Japan and San Francisco, I’ll share how to utilize visual tools to transform vague thoughts into shared insights and actionable ideas.
What Is Visual Thinking?
Visual thinking is a method for organizing complex and abstract ideas by expressing them visually. By using diagrams, sketches, icons, and maps, we can “make ideas visible”, helping us make sense of messy thoughts and build deeper understanding with others. It turns intangible information into something we can all see, creating shared understanding and encouraging dialogue and creativity.
This approach to visualization is used throughout various stages of the design thinking process.
However, visual thinking isn’t just about simply organizing ideas. It is especially powerful in areas such as new business development, where things are often unclear and there’s no obvious path to follow.
In these situations, drawing out ideas on whiteboards or sticky notes can help teams build shared hypotheses, spot new perspectives, and explore a broader range of possibilities, even in abstract discussions. That’s why visual thinking is gaining attention today, becoming more prominent at the front lines of business and innovation.
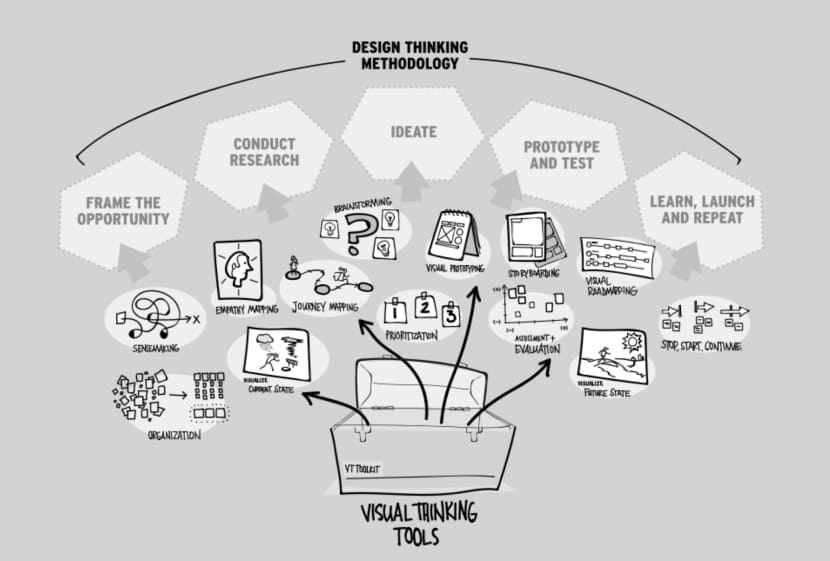
Various visual thinking tools are used throughout the different stages of the design thinking process. (Image source)
In innovation teams at global companies, visual thinking is increasingly used as a powerful tool to foster creative collaboration.
Take, for example, the Dutch manufacturer Philips, which used visual thinking when developing a new electric shaver. Throughout the process, the team used a mix of sketches and notes to share ideas, stay aligned, and build on each other’s thinking. This kind of visual co-creation is becoming a key factor in accelerating both the speed and quality of innovation today.
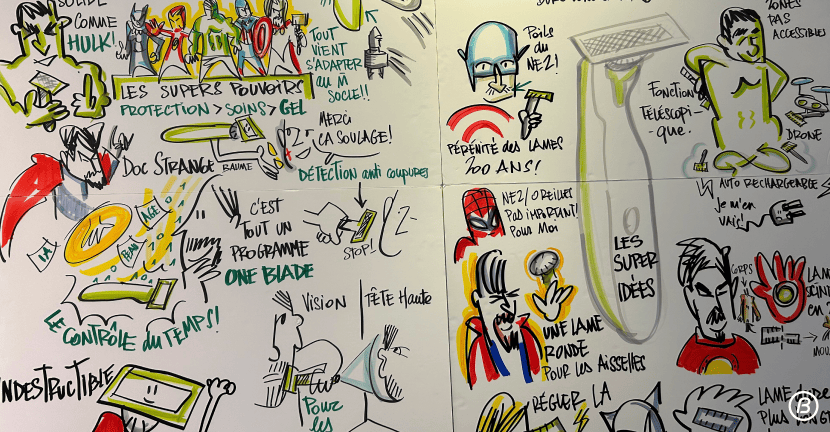
Sketches created by PHILIPS during the product development process
When people hear the term “visual thinking,” many assume they need to be skilled at drawing. But in reality, it’s not about artistic skill, it’s about the intention to communicate ideas clearly and simply.
Even with just basic elements like diagrams, symbols, stick figures, or arrows, you can make your thinking visible and support meaningful conversations. What matters is not how “good” your drawing is, but whether it gets your point across.
Practical Examples of Visual Thinking
Now, let’s take a look at three methods that show how visual thinking is used in real-world practice.
Each of these techniques is designed to make complex or abstract ideas and structures visible, thereby deepening team understanding and unlocking creativity.
Example 1: Sketch Synthesis
At IDEO, a global leader in design thinking, one commonly used technique during the research phase is called Sketch Synthesis.
Instead of summarizing interview findings or field observations in written form, teams visualize key moments, such as memorable stories or behaviors, through sketches. After that, these sketches are sorted into common themes to help the team make sense of insights and see the bigger picture.
IDEO’s blog post “To Make Sense of Messy Research, Get Visual” introduces the Sketch Synthesis process as follows:
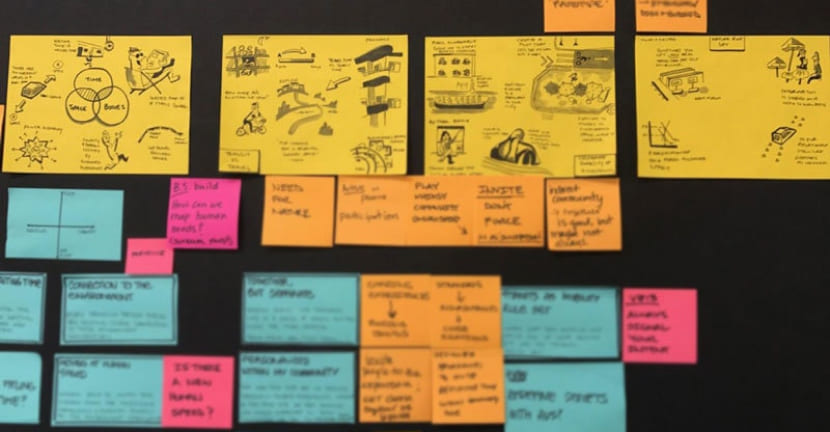
Step 1: Pare it down
Start by gathering all the raw data, including notes from interviews and field research, onto a large poster board or wall using sticky notes.
Then, select 4–5 of the most memorable moments or behaviors. Summarize each one and illustrate it with a simple sketch on a sticky note.
The goal is to distill the key takeaways and make them easy to see and share.
A sketch created by IDEO to illustrate the “ideal commuting experience,” based on interviews with users who have extreme or unconventional commutes, part of their exploration into transportation innovation.
Step 2: Cluster it up
The next step is to group the sketches you’ve extracted from the poster boards by common keywords or themes, combining them into one combined sketch. This process is similar to creating a mind map.
The purpose of this step is to make sense of what you’ve gathered. If something doesn’t feel essential, you can filter it out. Use the sketches as a way to filter through the noise and bring the most meaningful themes into focus.
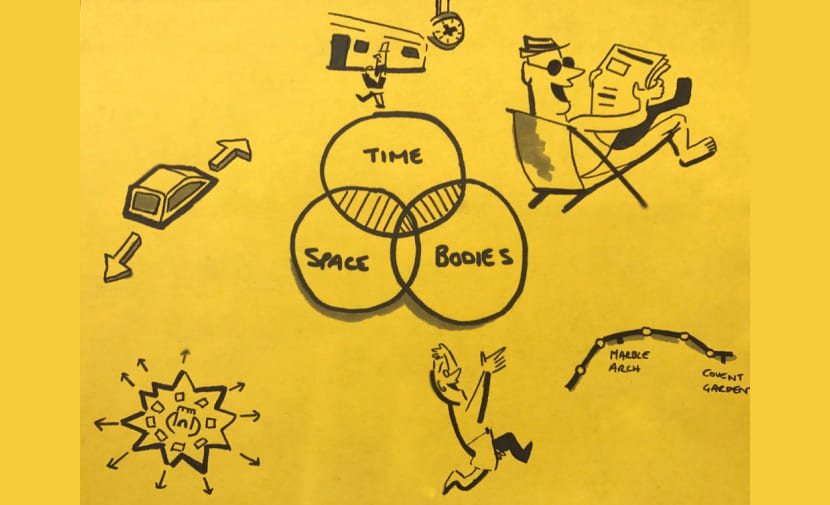
This sketch illustrates keywords and scenes related to “places.”
Step 3: Talk it through
Once the sketches grouped by keywords and themes are complete, the next step is for the entire team to review the visualized information together, aligning on the meanings and possibilities contained within.
Through this discussion, the sketches evolve into more concrete “design questions,” such as who has which problem that needs solving.
The goal of this step is to verify through team dialogue whether the interpretations of the research data are accurate. If there are any misunderstandings or missed insights, the team needs to revisit Step 1 and look for overlooked connections.
By going through this process, the depth and precision of interpretation improve, laying a solid foundation for developing new services.
At btrax, we also apply this approach in our new service development workshops, organizing collected information visually from various perspectives so that the whole team can grasp patterns, commonalities, and relationships at a glance.
Example 2: Storyboarding
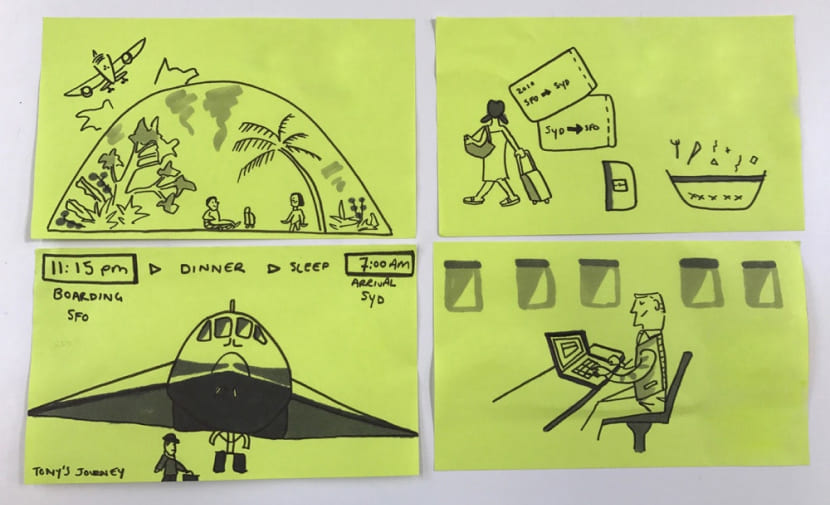
Storyboarding is a technique that visualizes scenes where a service or product is used, presented as a narrative or story. It was originally developed as a tool for use in filmmaking and animation, but now it has found a new role in service design and UX, helping teams envision the user journey and spark meaningful conversations.
The advantage of storyboarding is its ability to visualize abstract ideas as a sequence of experiences, showing who encounters the service or product, in what situation, and how they feel and act throughout the process.
By turning vague ideas into something others can imagine together and experience, storyboards enable teams to test concepts with users even before the ideas are fully developed.
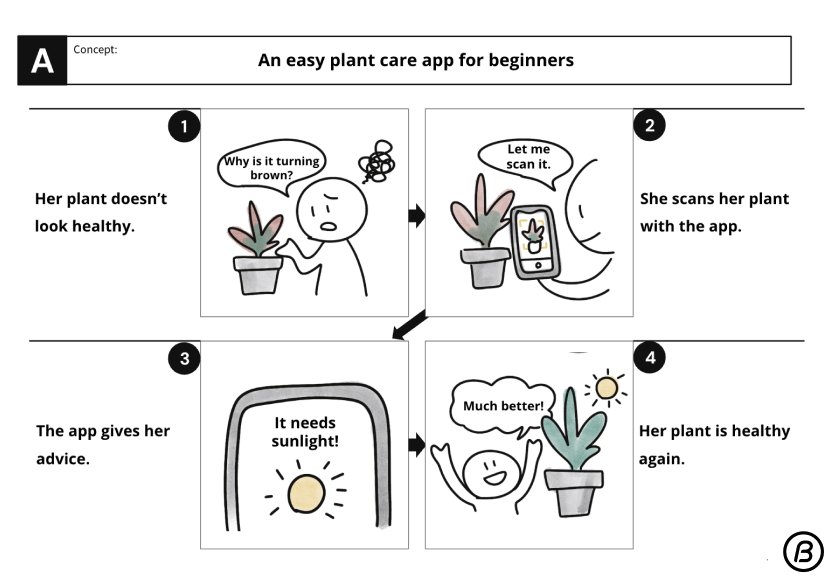
Storyboard
Using a storyboard to introduce an idea helps you show users what you mean more clearly than just explaining it with words.
Moreover, leaving the drawings a bit rough on purpose gives users more room to interpret the idea in their own way, which often leads to more honest and useful feedback.

A scene showing user testing being conducted using a storyboard
Example 3: Graphic Recording (Sketch Notes)
Graphic recording (also known as sketch noting) is another great example of practicing visual thinking.
It is a method of visually capturing the content of meetings or workshops in real time. Rather than just taking minutes, graphic recording illustrates the flow of conversation, key points, and even emotional nuances through drawings and diagrams. Sometimes, these visuals are used to facilitate dialogue, helping all participants deepen their understanding and build shared empathy.
Graphic recording originated in the 1970s in San Francisco. At that time, a major challenge in the fields of organizational development and facilitation was how to structure conversations and enhance participants’ understanding and shared awareness.
David Sibbet played a pivotal role in shaping this movement.
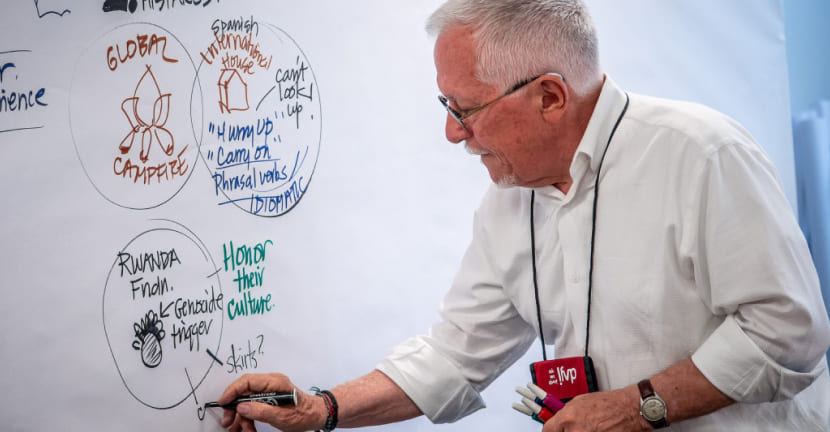
David Sibbet (Image source)
David Sibbet developed a technique of drawing large-scale sketches on walls in real time during conversations, capturing participants’ attention and making it easier to grasp the overall picture of complex discussions. This approach laid the foundation for what is now known as graphic recording and graphic facilitation.
In meetings such as brainstorming sessions, where diverse opinions are exchanged, or gatherings of stakeholders with differing assumptions, misunderstandings can easily arise when relying solely on words. In such cases, visualizing the content through graphic recording clarifies the big picture and key points for everyone, making dialogue smoother.
Today, graphic recording techniques have evolved beyond just drawing live during discussions. The visuals are also shared afterward to deepen understanding among stakeholders, used in social media posts, and displayed at events, becoming a versatile tool for communication.
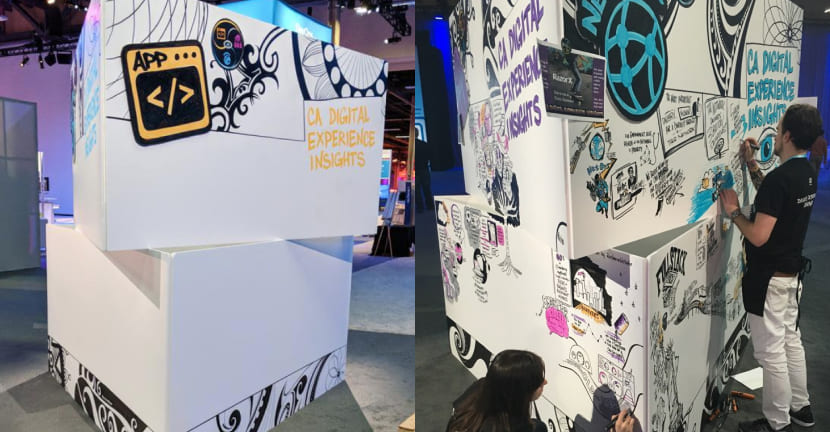
Graphic recording displayed at the CA World Expo in Las Vegas (Image source)
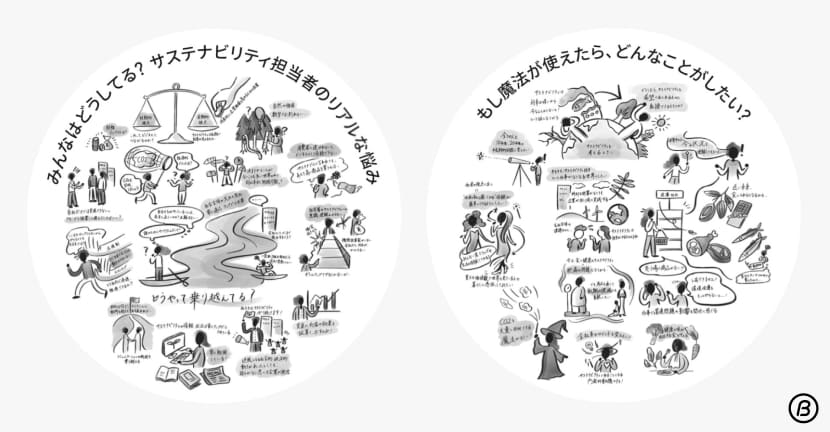
Graphic recordings I created, exhibited at Glass Rock Gallery in Toranomon Hills (see details here)
Graphic recording is typically done on a large scale, on walls or whiteboards, for example, but when visuals are drawn in smaller formats such as notebooks, notepads, or sticky notes, it’s referred to as “sketchnoting.”
I had the opportunity to study abroad in San Francisco from 2016 to 2017. During that time, I took a university class where one of the assignments was to create my own sketchnotes. I found that visualizing the information made it easier to reflect on the content and helped me understand it more deeply.
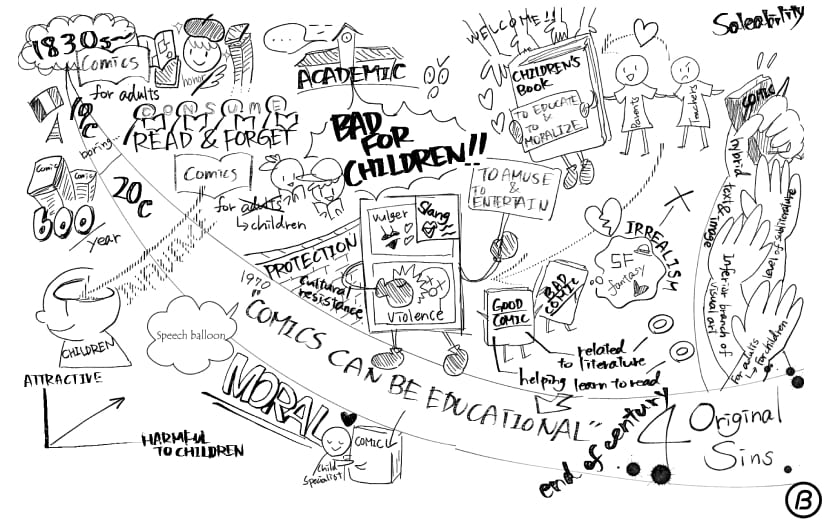
My first sketchnote, illustrating the history of comics
Back in Japan, where I went to school, taking notes with drawings was often seen as just “doodling.” But in many design schools abroad, especially in the U.S., creating visual notes like these is actually encouraged.
Practicing this kind of visual thinking and expression on a daily basis is a powerful way to develop and apply visual thinking skills.
Let’s Put It Into Practice
As we’ve explored, visual thinking plays an essential role in organizing abstract ideas, building shared understanding within teams, and facilitating deeper conversations, especially when words alone fall short. Leading organizations, such as IDEO, have recognized its value, using it as a foundation for innovation.
Visual thinking is not just for people with artistic talent. Even if you’re not good at drawing, you can still use lines, shapes, and simple sketches to clarify your thoughts and communicate them effectively. In that sense, visual thinking is a tool anyone can use.
When abstract ideas are put into visual form, they can spark shared understanding and lead to new insights. In today’s world, where collaboration and co-creation are key, this visual approach is becoming increasingly essential in both business and innovation.
At btrax, we leverage visual thinking and design thinking methods to support innovation within large enterprises, launch new businesses and services, improve existing operations, and drive organizational transformation.
If you’re interested in learning how btrax can help bring your next activation or experience to life, visit btrax.com to explore our design and marketing services. Here are some examples of how we worked with clients using Visual Thinking techniques:
Japan GTM for AI Startups
Build trust, connect with decision-makers, and accelerate your Japan market entry through events, community, and localized GTM execution.